


At the end of January 2022, non-fungible token (NFT) sales raked in $4.77 billion and NFT sales have slipped month after month since then. Last month, $549.82 million in NFT sales took place in September which shows monthly NFT sales are more than 88% lower than they were in January. Furthermore, after the search term “NFT” reached the highest score on Google Trends last January, tapping a score of 100, the last week of September’s score was 12, which is also 88% lower in terms of interest.


NFT Trade Volume and Search Queries Slide — Sales and Interest Down 88%
Non-fungible token (NFT) technology was very popular at the end of 2021 and during the first month of 2022. In fact, in terms of Google Trends data (GT), worldwide the term “NFT” scored the highest score a search query can get on the GT database, which is 100.

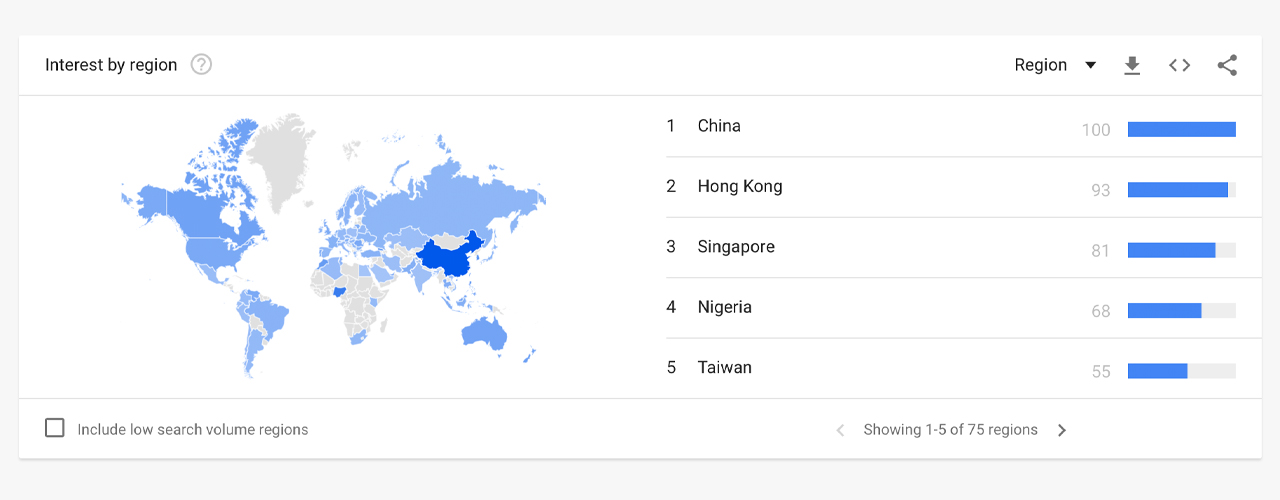
In fact, it was the first time the search term tapped this region according to the GT database, but today the score is 88% lower with a score of 12 during the week of September 25 through October 1, 2022. Today, China is the most active region according to GT metrics and the country is followed by Hong Kong, Singapore, Nigeria, and Taiwan.
Sales have slid since January as well, as records show that NFT sales were just above the half-billion mark or approximately $549.82 million. The number is approximately 88.49% lower than the $4.77 billion in NFT sales recorded eight months ago.
May was the last month that NFT sales printed above the $1 billion mark and that month $3.18 billion in NFT sales were recorded. The following month was a significant slide down to $879 million and in July, NFT sales saw $682 million. August sales slid lower after $633 million in NFT sales were recorded that month, and September’s sales are 13.27% lower.
So far, the first week of October 2022 has seen $105.22 million in NFT sales…