


Data is our best bet to understand the past, present, and future.


In traditional finance, obtaining data is relatively difficult. On the other hand, the blockchain has broken barriers to data, giving everyone access to a giant ledger of information. However, the amount of available data has created another problem: Finding valuable information is complicated.
There are dozens of tools out there to help people analyze DeFi data with a variety of metrics. However, these metrics are mostly quite basic. In this article, we will introduce the most useful metrics as well as the more advanced data available on Footprint Analytics’ upcoming tool, DeFi 360,
Basic Data
TVL is usually the first metric people look at and it reflects the total value of all assets locked by users. TVL growth is often used to judge whether the project is in an upward trend.
TVL is measured in dollars. Since cryptocurrency prices change rapidly, it is difficult to see whether the rise or fall in TVL is due to the price change or the addition of more investments. Therefore, in addition to the TVL, it is also necessary to pay attention to the adjusted TVL.
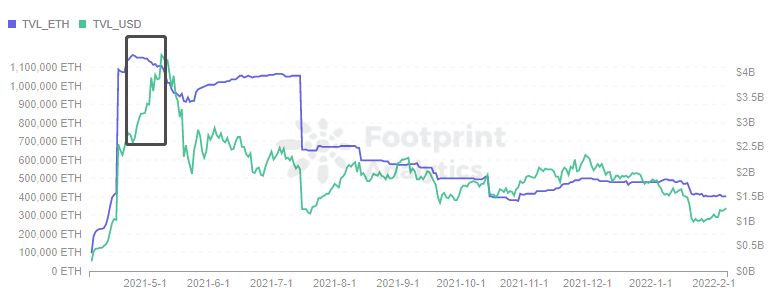
For example, statistics from Footprint Analytics show that TVL in ETH of Liquity (a lending program that can only lock ETH to lend out stablecoins) is slightly down in the black frame of the chart below, while TVL in USD is increasing. This is due to the rising price of ETH, which creates the illusion that the project is on an upward trend.
Complex projects like Aave and Yearn, which offer both lock and lend functions, complicate the use of TVL as a metric and necessitate combining it with others.
Net liquidity refers to the change of inflow and outflow from the previous day or month. The changes can be further analyzed in terms of both inflow and outflow, and whether the main source is user entry or loss.
DEX-based protocols cannot be measured by TVL alone since swaps also…