


This post contains sponsored advertising content. This content is for informational purposes only and not intended to be investing advice.


AT-A-GLANCE
- The recent de-risking of portfolios may not be the best explanation of bitcoin’s recent selloff
- Rising miner revenue per transaction may have signaled past bitcoin selloffs
- Movement sideways in the number of bitcoin transactions may indicate a lack of growth in its user community
In between its low points set on March 2020 and April 2021, bitcoin prices advanced 1,557%. They have struggled since. By late July bitcoin fell 55% from its high. It then staged a second rally, gaining 133% by early November, hitting a new record high, before falling by as much as 52% over the past three months.
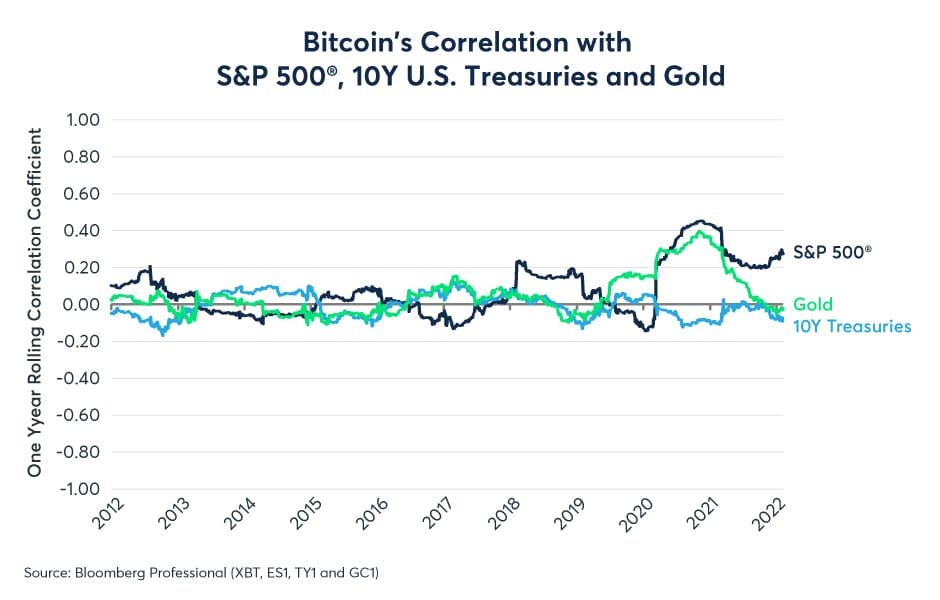
Bitcoin’s most recent decline coincided with turbulence in the equity market, which also corrected in the first month of 2022. However, the idea that bitcoin’s recent decline is primarily a result of portfolio de-risking may be focusing too much on bitcoin’s positive, but rather weak, correlation with U.S. equities. Over the 12 months to early February 2022, bitcoin had a +0.29 correlation with the S&P 500® (Figure 1). This implies that movements in the equity market explain only about 9% (the square of the correlation coefficient) in the daily price movements of bitcoin.
Figure 1: Bitcoin has weak correlations with traditional financial instruments
A more convincing explanation of bitcoin’s recent selloff lies within the bitcoin market itself, and it relies on two factors: miner revenue per transaction and the number of transactions.
The Role of Miner Revenue Per Transaction
Bitcoin’s two recent 50%-plus bear markets are not its first. Since its inception in 2009, the currency has experienced a number of even larger declines, three of which saw the currency fall by over 80%:
- A 93% decline between June and November 2011
- An 86% decline between November 2013 and January 2015
- An 84% decline between…