


Many cryptocurrency enthusiasts have heard of the Pi Cycle Top indicator, which has “magically” predicted the peaks of several previous bull markets. However, few know that there is also its opposite, Pi Cycle Bottom, which also has some track record in trying to estimate the bottom of a bear market.


But before we take a closer look at Pi Cycle Bottom, let’s remind ourselves why its bullish nemesis has earned so much popularity.
The historic effectiveness of the Pi Cycle Top
We first wrote about the Pi Cycle Top on BeInCrypto over a year ago, when Bitcoin was close to reaching its previous all-time high (ATH). The indicator is based on the relationship between the double of the 350-day DMA and the 111-day DMA. The signal fired on April 12, 2021, and just two days later, Bitcoin reached a historic ATH of $64,900.
This high accuracy of the Pi Cycle Top was not an exception, as the indicator has been very effective in previous cycles as well. All 3 historical ATHs of previous bull markets coincided with the signal flashing up no more than 5 days before or after the peak.
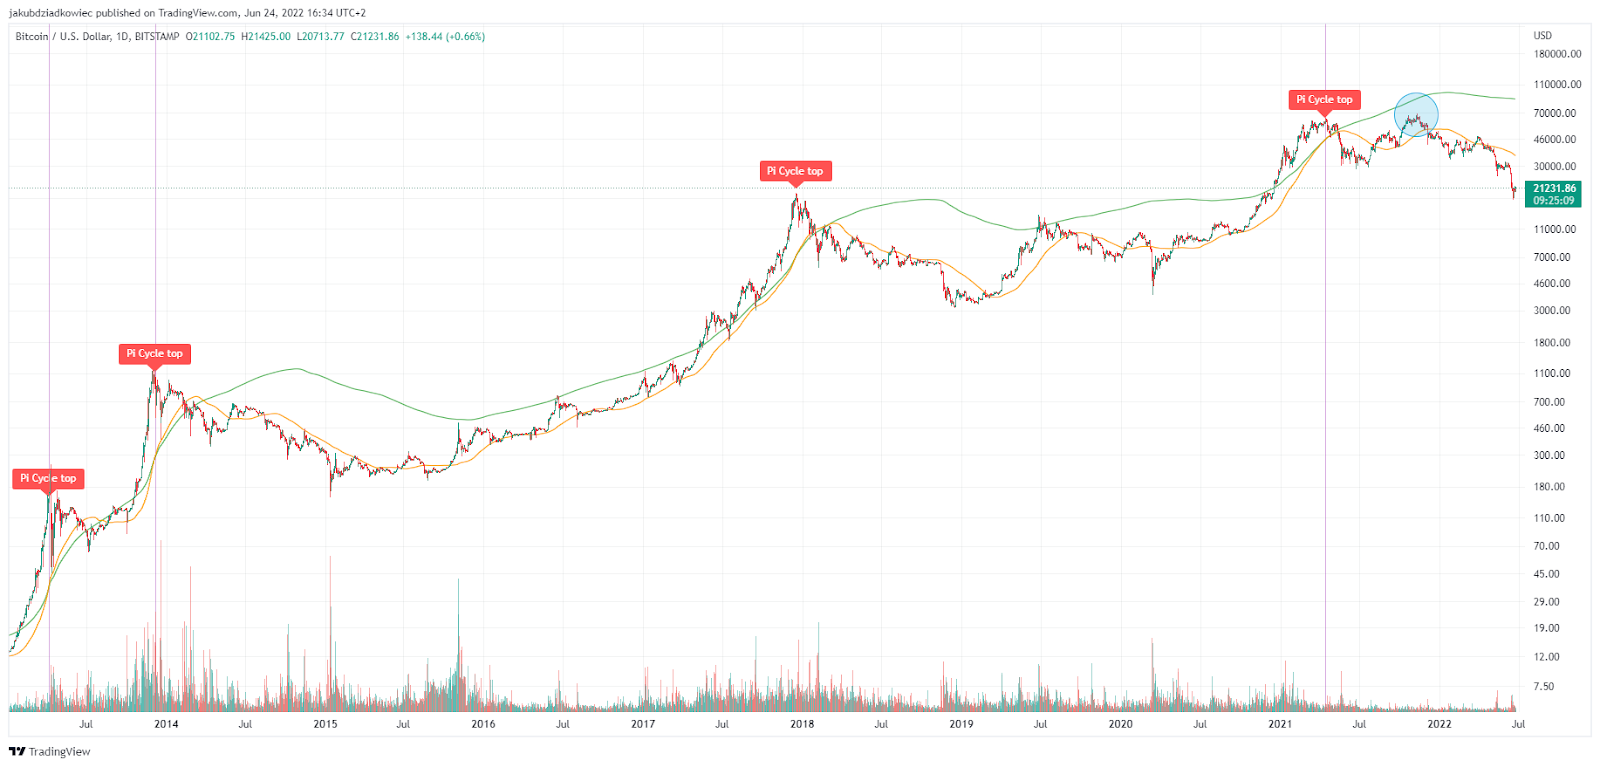
The only ATH during which the Pi Cycle Top was far from crossed is the most recent one. On November 10, 2021, when BTC reached $69,000, the indicator failed to generate a signal. At the time, this was interpreted as a sign that the second wave of the bull market was not yet over. Today we know that the indicator failed in this case.
Pi Cycle Bottom and the end of a bear market
Pi Cycle Bottom is the opposite of Pi Cycle Top. The bearish version is the relationship between the 471 SMA and the 150 EMA. Moreover, the former is multiplied by a factor of 0.745. Not a very elegant construction, but historically quite effective.
As it turns out Pi Cycle Bottom indicator could be successfully used to estimate the area of the absolute bottom of two previous bear markets (blue lines).
The first time the 150 EMA fell below the 471 SMA was on January 16, 2015. This happened just two…