


In today’s on-chain analysis, BeInCrypto compares the Stablecoin Supply Ratio (SSR) and its oscillator to the altcoin market capitalization chart. The goal is to try to determine whether to expect the arrival of the first altcoin season in 2022.


In today’s on-chain analysis, BeInCrypto compares the Stablecoin Supply Ratio (SSR) and its oscillator to the altcoin market capitalization chart. The goal is to try to determine whether to expect the arrival of the first altcoin season in 2022.
If you look at the charts of WAVES, which pumped 285% in 16 days, or LUNA, which just set a new ATH, it seems like these are the first harbingers of this year’s altcoin season. However, despite these exceptions, most altcoins are in a long-term downtrend – against both USD and BTC.
Nevertheless, the chart of altcoin market capitalization (TOTAL2) is approaching a long-term, rising line of support. A bounce from it could initiate a trend reversal and the start of a new altcoin season. Moreover, the Stablecoin Supply Ratio provides signals that after a period of Bitcoin consolidation, capital may soon flow into riskier altcoins.
Long-term support and resistance for TOTAL2
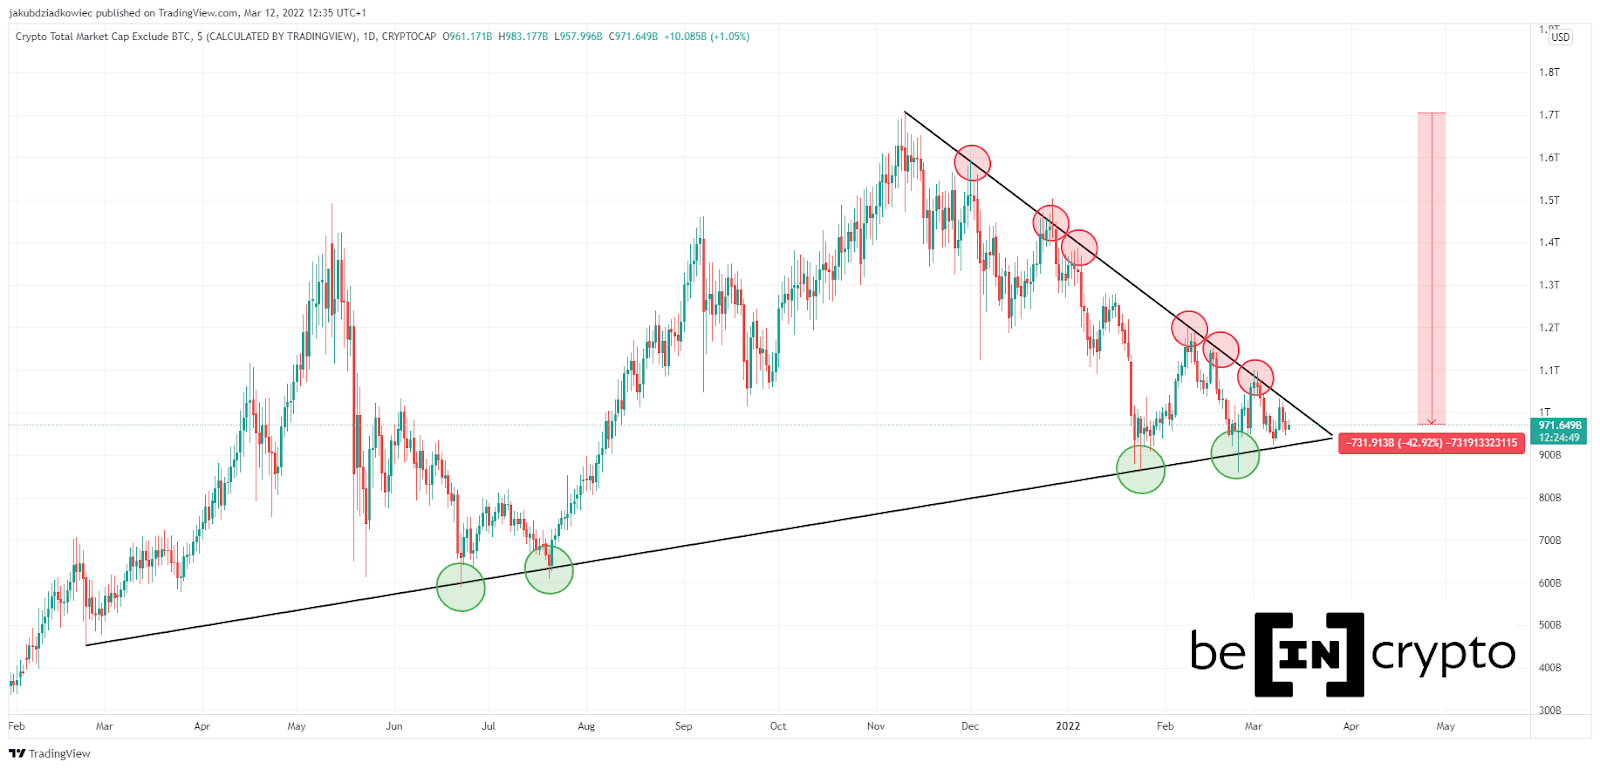
The TOTAL2 chart has been in a downtrend since the all-time high (ATH) of $1.07 trillion set on November 10, 2021. Since then, the price has followed a descending resistance line that has rejected every breakout attempt at least 6 times (red circles). The correction has now lasted 122 days and TOTAL2 has declined by 43% reaching $971 billion today.
On the other hand, the decline has led to a confirmation of the rising support line again, which has been in place since February 2021. Previously, this line served as support in June and July 2021. A bounce from it led to the aforementioned ATH. In total, this line has already been validated as support 4 times (green circles).
Cryptocurrency trader @CryptoPoseidonn tweeted a chart of TOTAL2, indicating a possible major breakout. He…